Resource Management

The MyLightedge Resource Management tab provides a comprehensive overview of all your resources deployed across your Lightedge-managed multi-clouds. Supported environments include:

|
AWS |

|
Azure |

|
Google Cloud |

|
VMware |

|
IBMi |
The table accounts for each resource type that is deployed across your Lightedge-managed multi-cloud. This includes:

|
COMPUTE |

|
STORAGE |

|
NETWORK |

|
CONTAINERS |

|
IDENTITY |

|
TOTAL |
From there you can open a detailed view of your deployed resources by selecting any of the clickable numeric table cells. Depending on the cloud-type you will be directed to one of the following views:
for Azure, AWS and Google Cloud Types |
|
for VM Ware deployments |
|
for IBMi deployments |
Resource Management - Cloud Details View
While the Dashboard’s Resource Management Tab provides a numeric footprint of your cloud-resources, the Resource Management Cloud Details View helps you inspect individual resources.
Note
For instance, if you selected the AWS Cell in the Compute Resource column, MyLightedge will display a Resource Details view that is filtered to display AWS compute resources only.
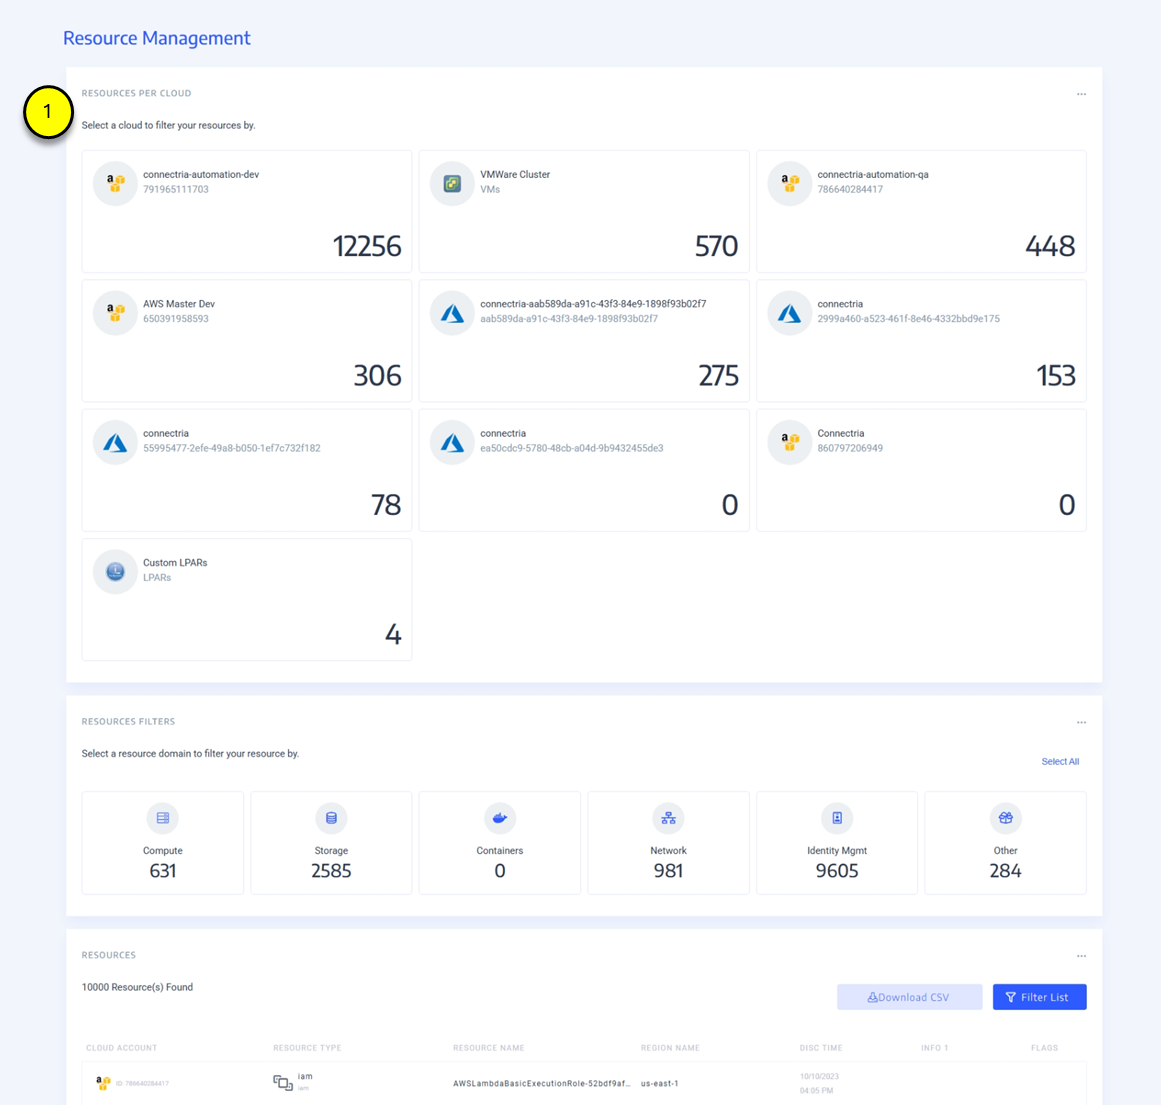
- 1 By default, MyLightedge will always display the view of all your known resources. There is however always
a means to filter to either a specific resource and/or a subset of your overall resources as well.
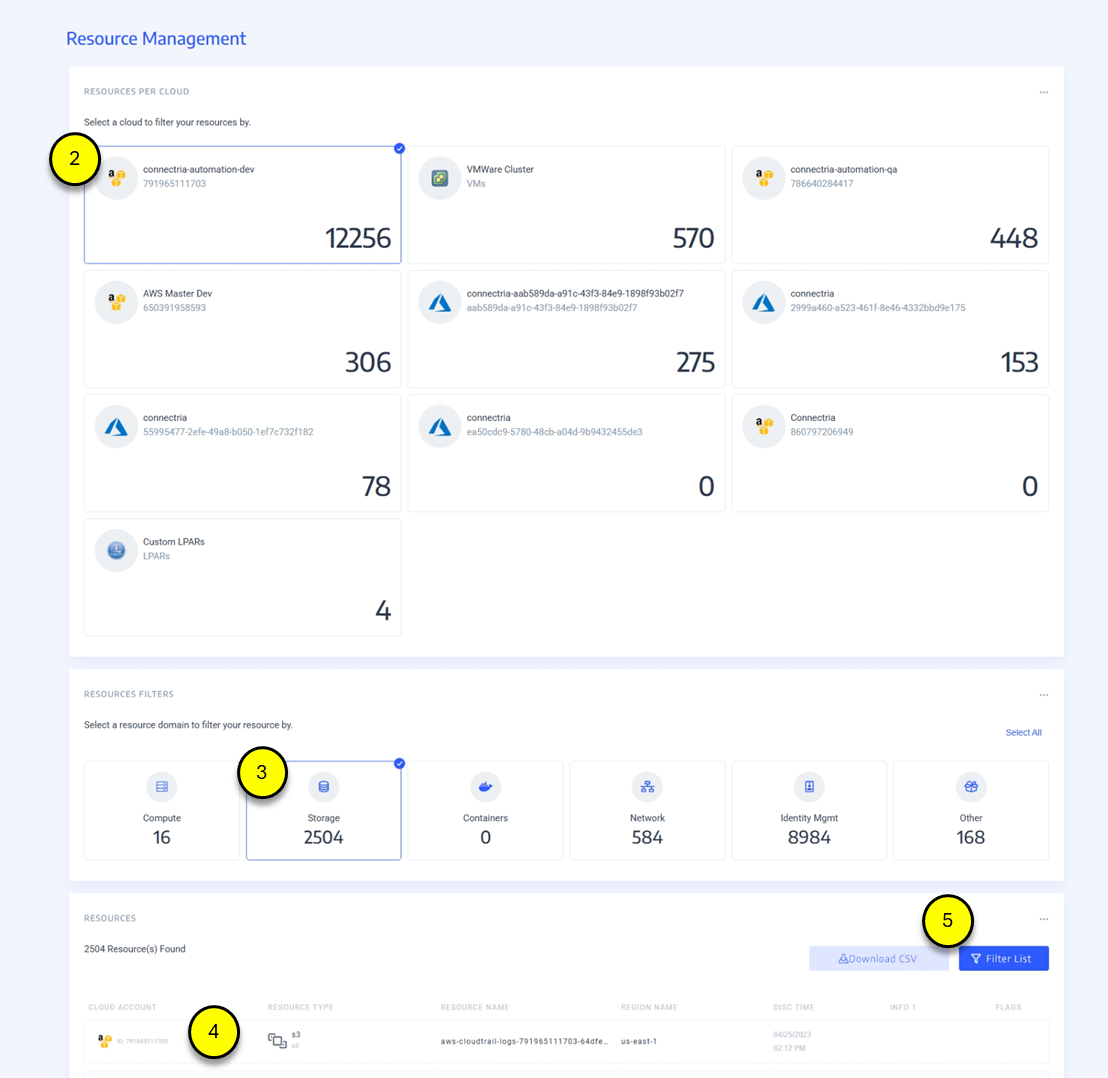
- 2 To select a specific resource or resources click on that resource(s) within the Resources Per Cloud section,
the resource will become outlined in blue. To De-select a resource click on the resource once more.
- 3 To select a specific resource domain, click on any of the resource filter categories such as: Compute,
Storage, Containers, Network, Identity Mgmt, and/or Other.
4 To view details of a given resource scroll down to the Resources table and select the resource you wish to see additional information about. A detail blade will then pop up on the right side of the screen and provide the following types of information:
Account Details
Tags
Resource Properties
Resource Centric Data such as: - Block Device Mappings - Capacity Reservation Specification - CPU options - DB Parameter Groups
- 5 Using the ‘Filter List’, the resources can be searched, filtered by many different data points, downloaded,
and its columns can be augmented by clicking on the column you wish to sort.
Resource Management - VMware Devices
The Devices View provides a searchable list of VM Ware devices.
1 The view can be exported to a .CSV.
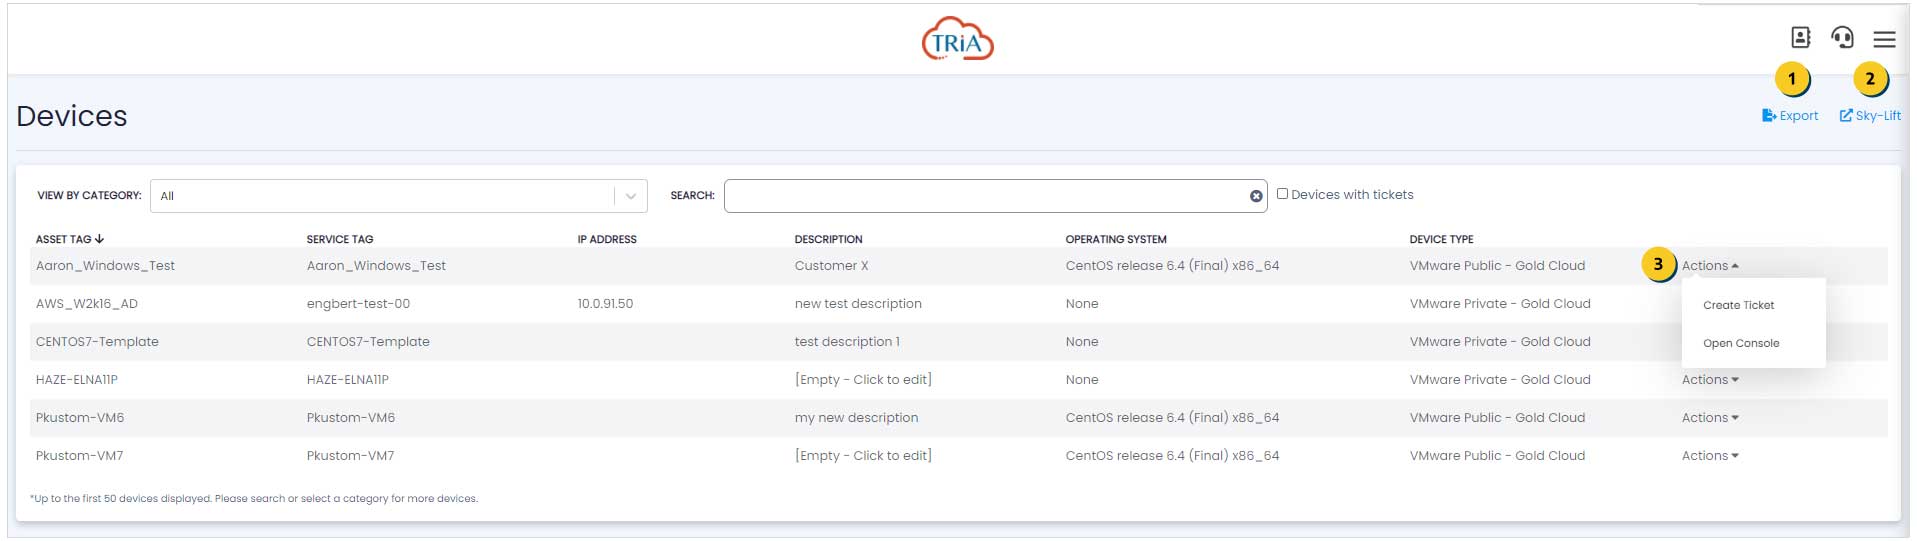
- 2 The Actions can be found within the detail blade on the right side of the screen once a specific VMWware
device has been selected. From here you can view your Performance metrics such as Average CU load, Memory Used, Response Time, and Packet Loss. You can also view or set any new maintenance windows within Alert Settings. Lastly you can ‘Open a Ticket’ or open your ‘Console’.
Resource Management - IBMi LPARS
The `IBMi Dashboard` view provides a central location to quickly ascertain your IBMi-deployments status, and performance health. These metrics automatically refresh every 15 seconds.
1 A countdown indicating the refresh-rate is provided in the top-right corner.
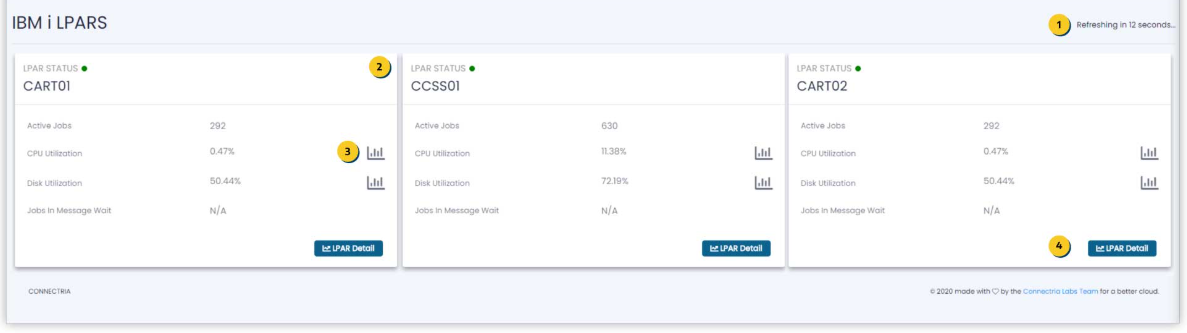
Each Logical IBMi Partition 2 shows:
Value |
Descriptions |
Relevance |
|---|---|---|
LPAR Status |
|
Indicates your LPAR’s current system status |
Active Jobs |
Number of active jobs/ processes |
Indicates the numeric size of your LPAR partition. |
CPU Utilization % |
The calculated CPU time that is derived from the reported consumed CPU time divided by the reported available capacity. |
CPU Utilization constitutes a proxy value for the relative load your system is under. Calculated as a percentage of your LPAR’s overall CPU Capacity, it indicates how close your Logical Partition is to meeting or exceeding its available compute capacity. |
Disk Utilization |
The calculated Disk Utilization level |
Disk Utilization is an important metric that indicates how much of your Device’s disk memory is in use. |
Jobs in Message Wait |
A job enters the ‘In Message Wait’ status when it is waiting for a response to an inquiry message (MSGW status). This could be because a dependency of this job hasn’t generated the desired response. |
A high number of ‘Jobs in Message Wait’ may indicate a dependency or computational bottleneck in your system. This can ultimately slow down your system’s efficiency, response times and/or introduce latency. |
3 You can also access a graph visualizing for each of your LPAR’s 'CPU Utilization %' and 'Data Utilization %':
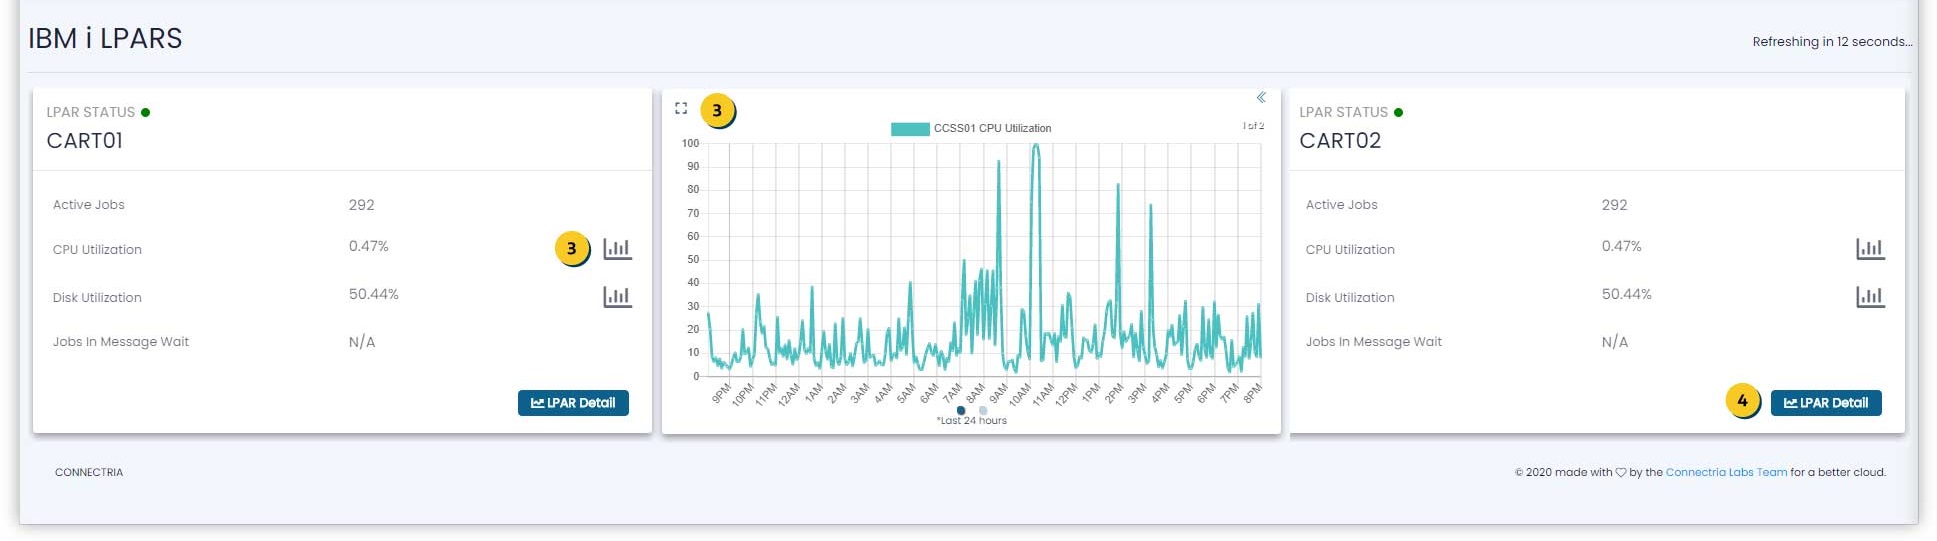
4 You can access more details about your LPAR by selecting the `LPAR Detail` button.
IBMi LPAR Details Dashboard
By default, the LPAR Details View displays basic configuration details along with basic performance indicators for the last 24 hours.
1 You can switch LPAR via the dropdown selector.
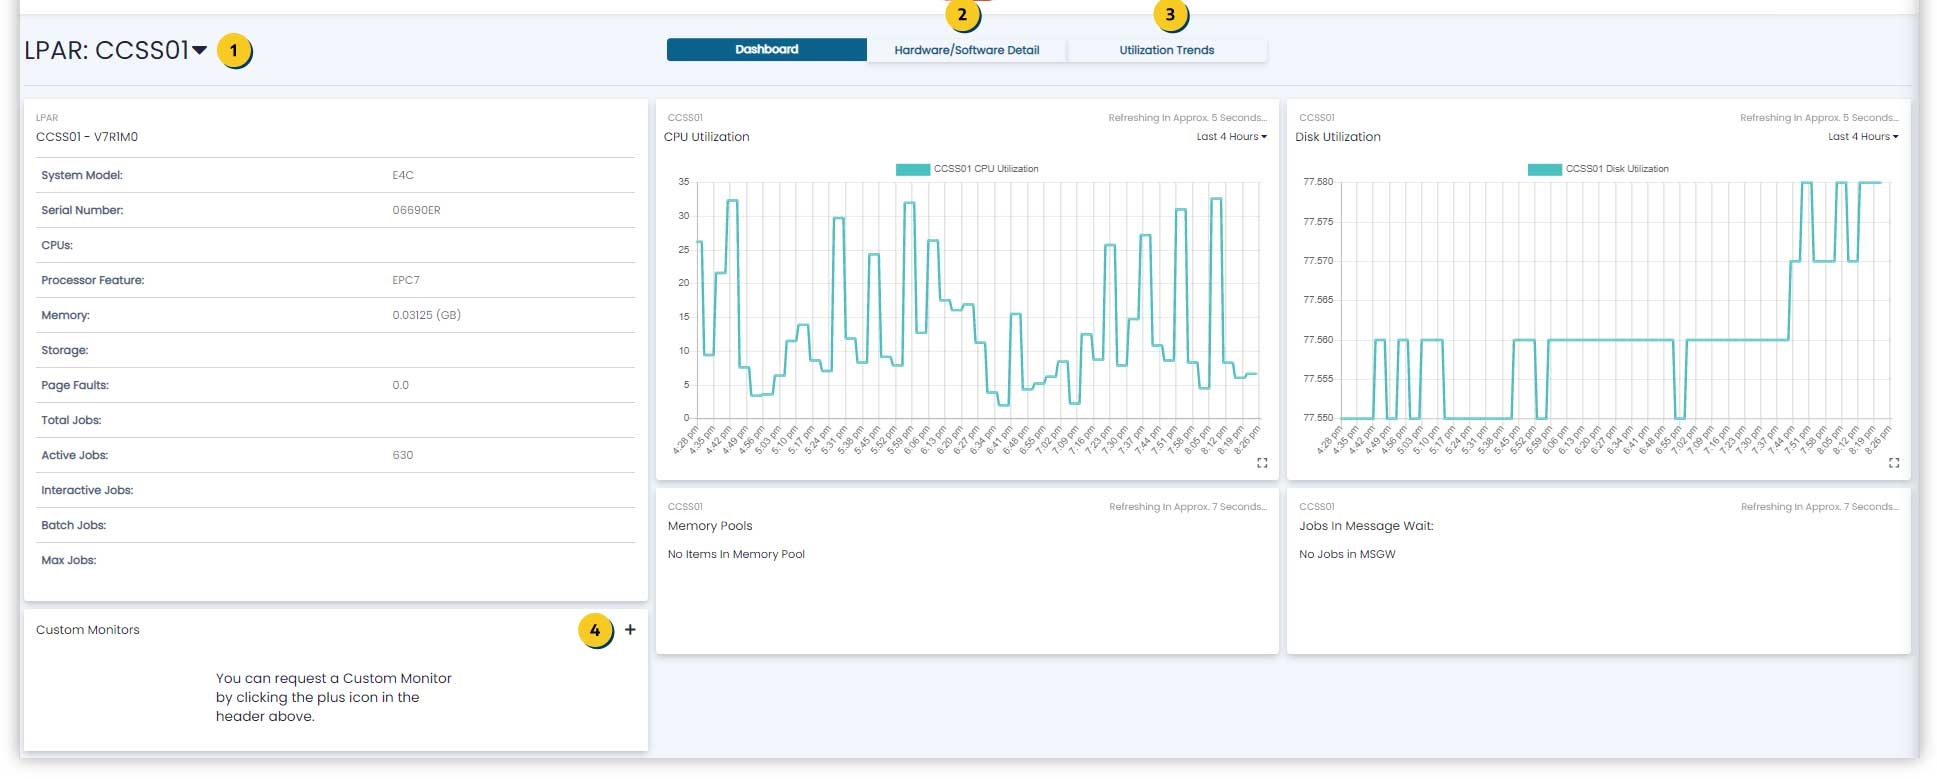
These include:
Value |
Descriptions |
Relevance |
|---|---|---|
CPU Utilization % |
The calculated CPU time that is derived from the reported consumed CPU time divided by the reported available capacity. |
CPU Utilization constitutes a proxy value for the relative load your system is under. |
Disk Utilization |
Utilized disk indicates how close your Logical Partition is to meeting or exceeding its available disk capacity. |
Calculated as a percentage of your LPAR’s overall Disk Capacity. |
Memory Pools |
||
Jobs in Message Wait |
A job enters the ‘In Message Wait’ status when it is waiting for a response to an inquiry message (MSGW status). This could be because a dependency of this job hasn’t generated the desired response. |
A high number of ‘Jobs in Message Wait’ may indicate a dependency or computational bottleneck in your system. This can ultimately slow down your system’s efficiency, response times and/or introduce latency. |
4 You can request for additional monitoring cards to be added by submitting a ticket via the ‘+’ – icon in the Custom Monitoring card.
Hardware/ Software Detail
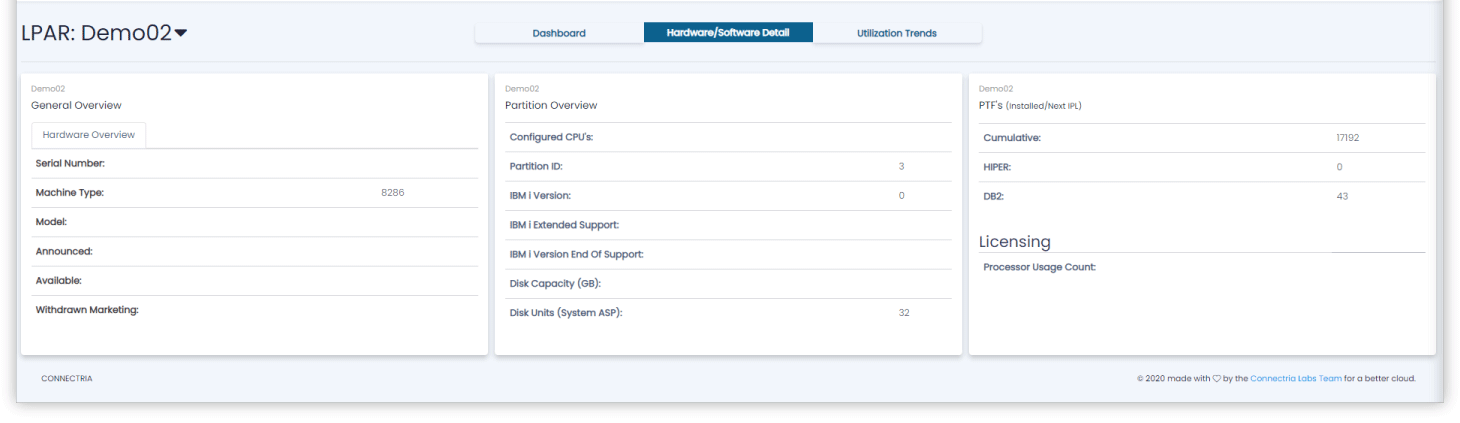
The Hardware/ Software Details tab shows the LPAR’s hardware and software configuration details:
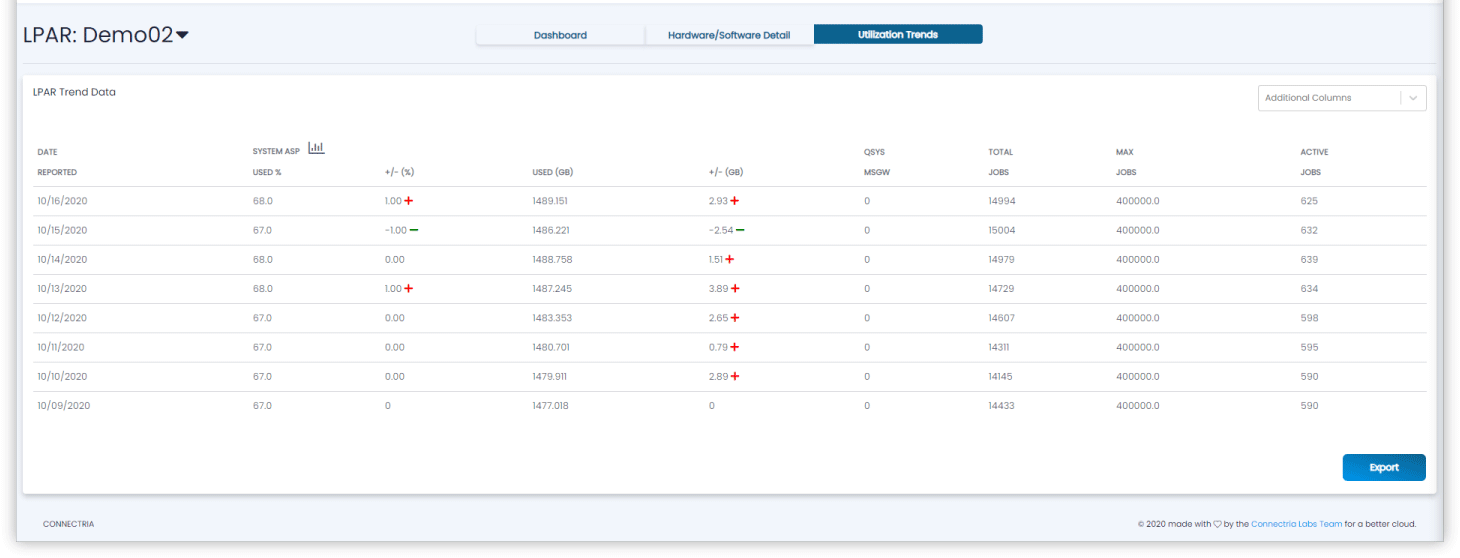
Utilization Trends
Utilization Trends show your LPAR’s ASP Used Disk Space trend as measured in percentage changes and used